Today is our last Blog Post. We had a lot of fun with this project and learned a lot.
Below we list all important links to in regards to our work in this project:
Blog
First Semester
- Week 1: Project Vision
- Week 2: Project Roles/ Technology
- Week 3: Software Architecture Document and Overall Use Case Diagram
- Week 4: First Use Cases
- Week 5: Integrated Scrum
- Week 6: Feature Files
- Week 7: Class Diagram
- Week 8: Software Architecture Document
- Week 9: Gantt Chart
Second Semester
- Week 2: Risk Management and Scope
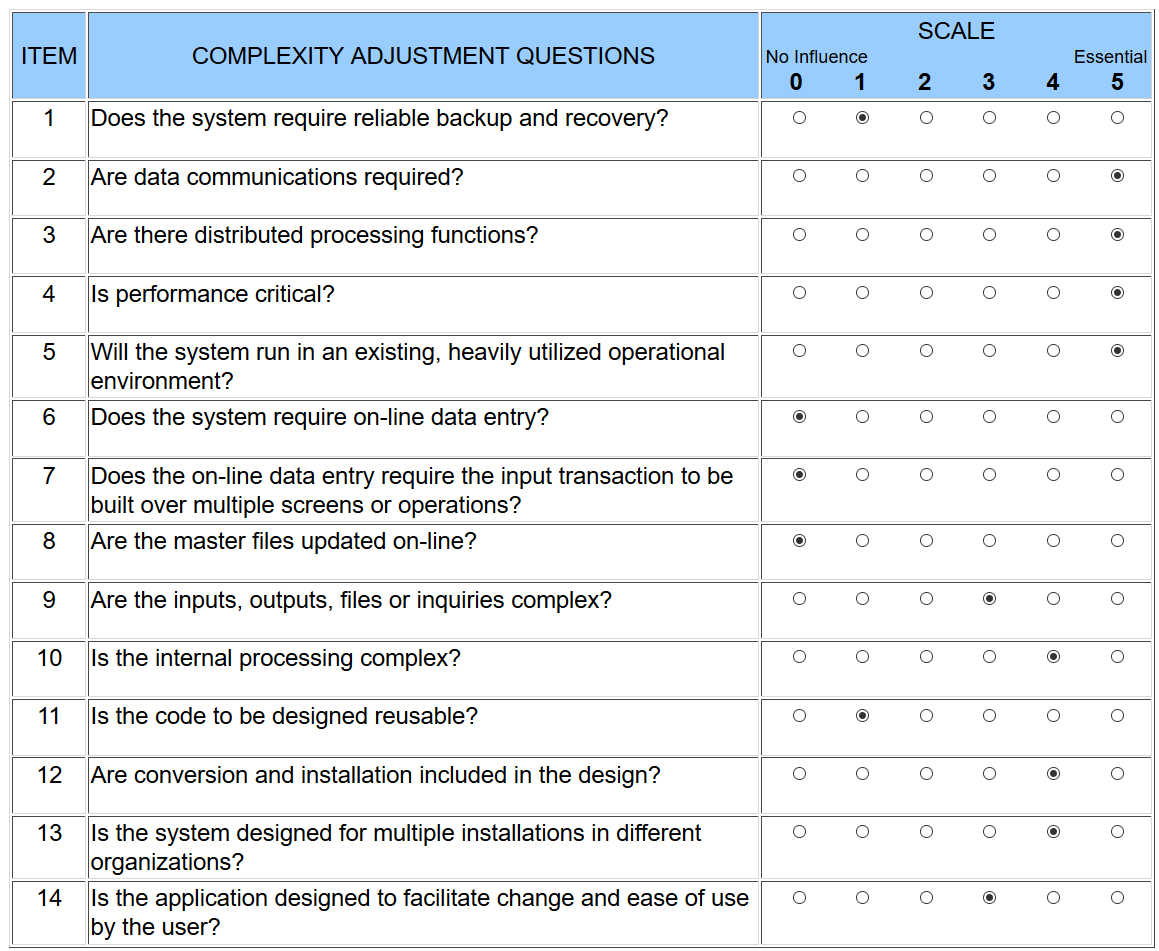
- Week 3: Function Points
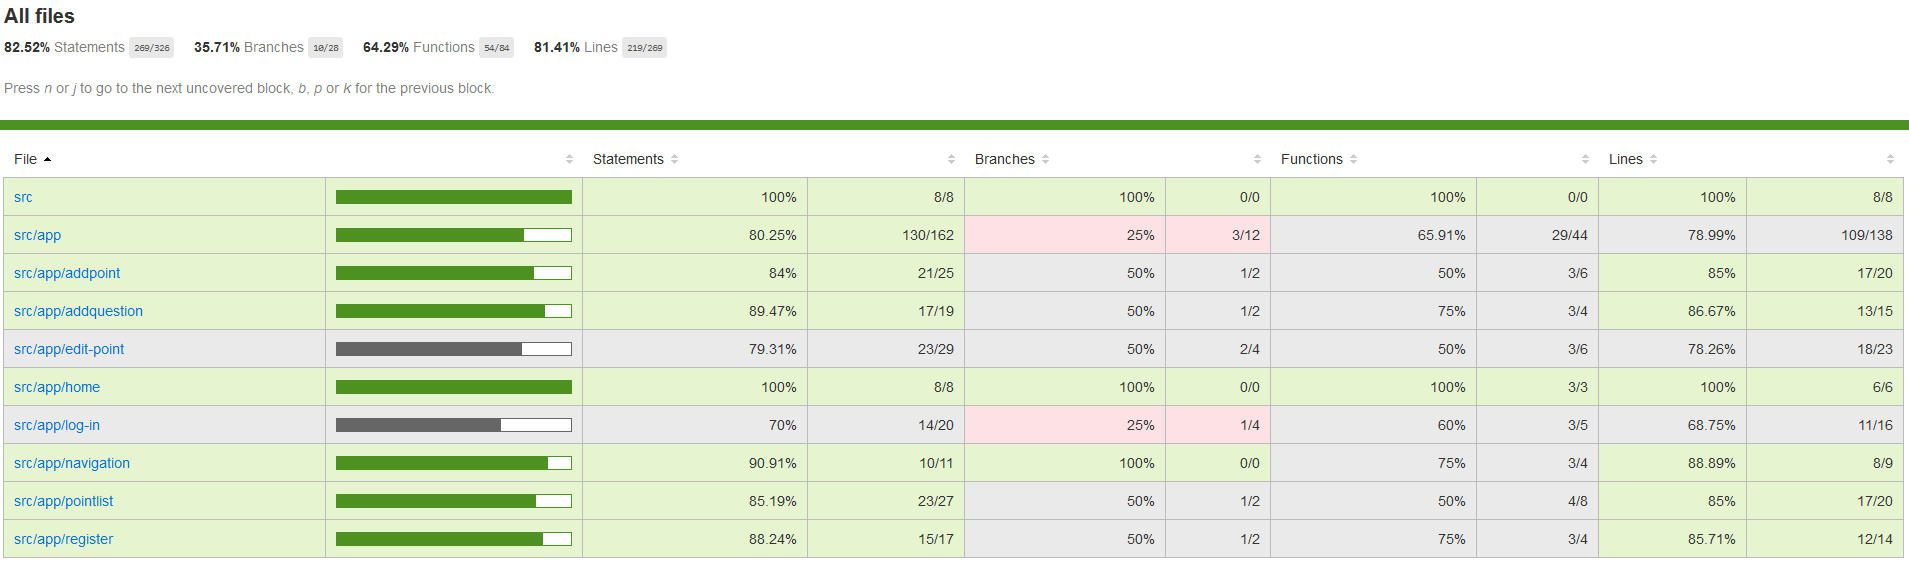
- Week 4: Testing
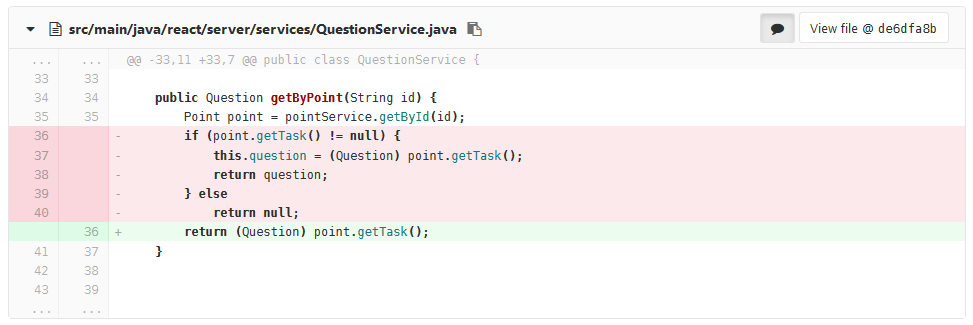
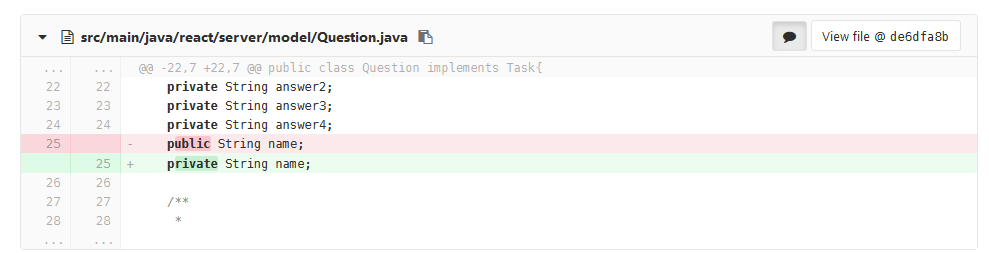
- Week 5: Refactoring
- Week 6: Pattern: Facade
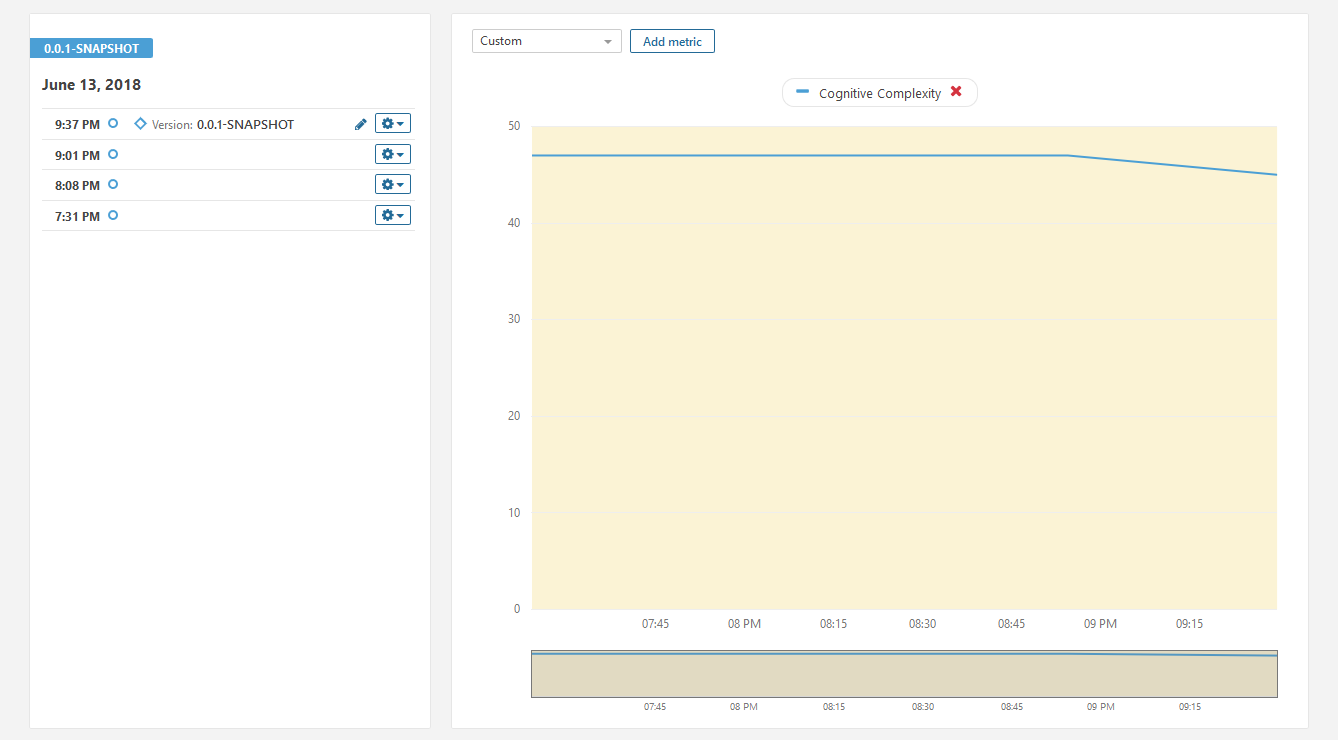
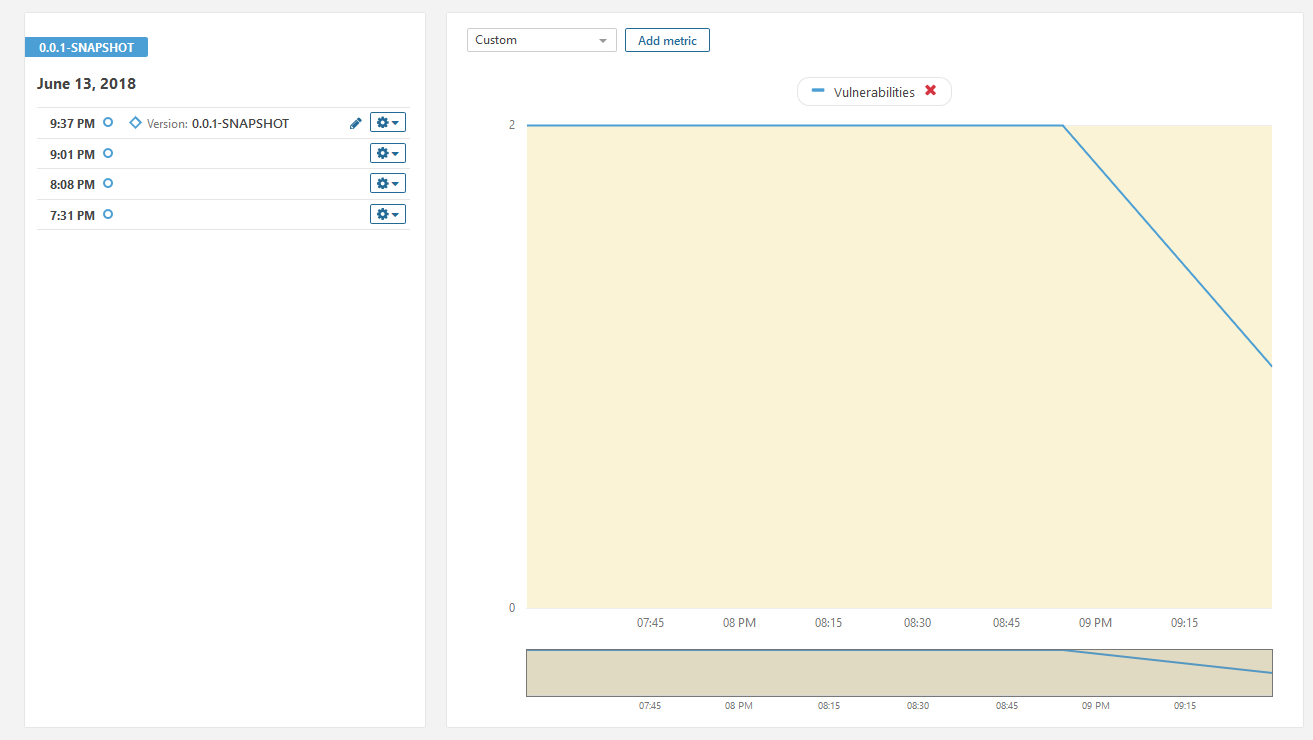
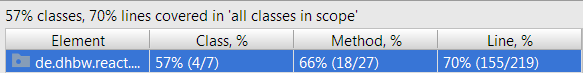
- Week 7: Metrics
- Week 8: Installation – APK
Gitlab repo
Project vision
RUP project Roles
Software Requirement Specification
Use Cases
- Blog Post
- Point CRUD
- Player Move
- Capture Location
- LogIn/Register
- Play in Map View
- Play in AR Surface
Project management
Testing
- Test Plan
- Cucumber Blog Post
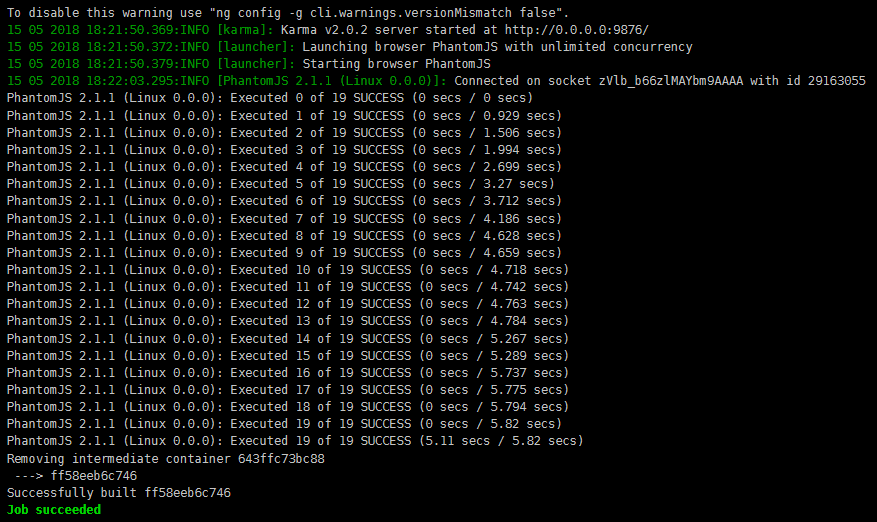
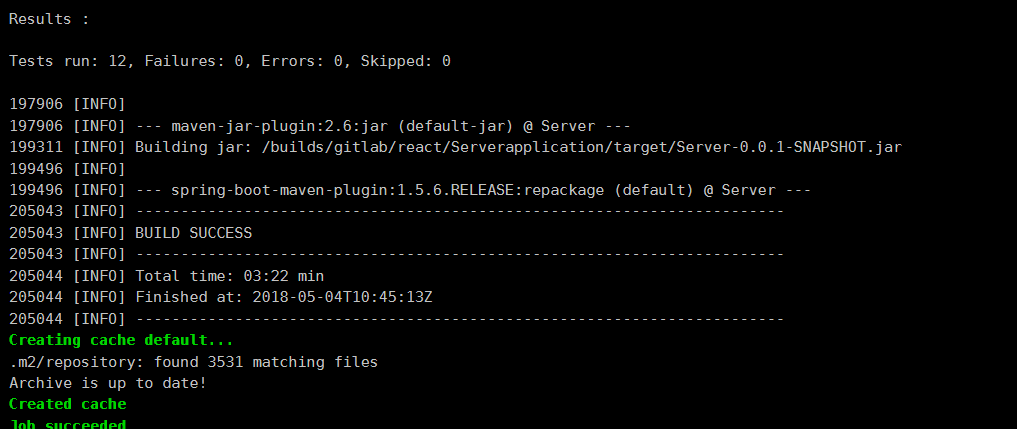
- Unit Testing Blog Post
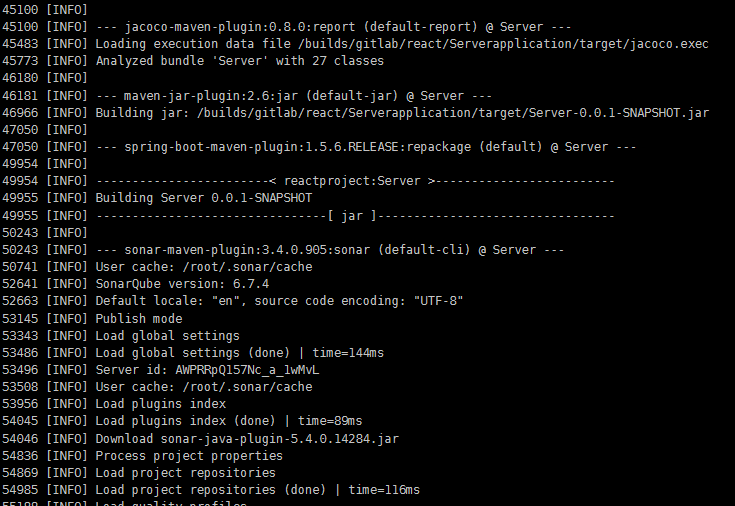
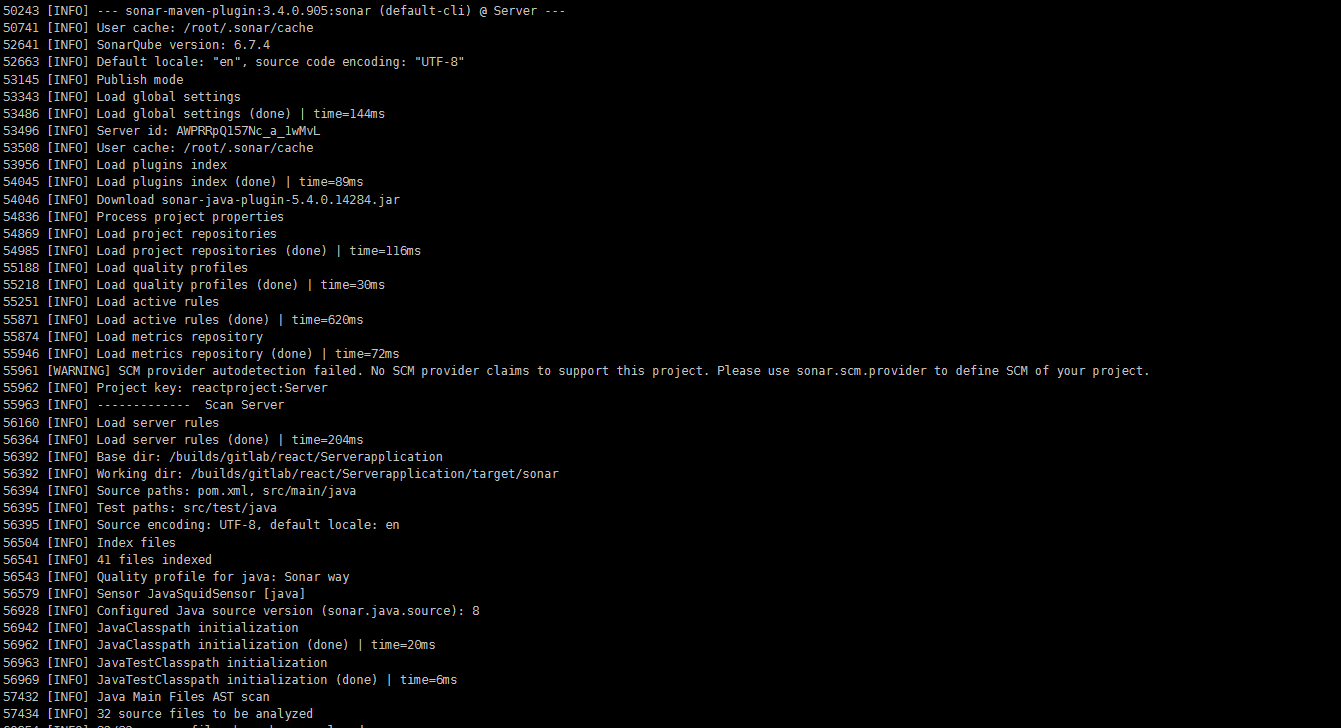
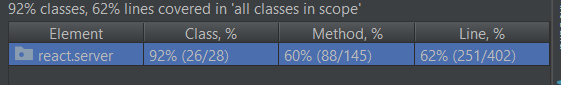
- Metrics Blog Post
- Proof of Installation Blog Post
Architecture
- Class Diagram Blog Post
- Package Diagram and Software Architecture Document Blog Post
- Design Patterns Blog Post
Long-term planning
Presentation
ZIP
Here is our Zip. It includes our code, documentation, and blog posts.
It was pretty fun working on this project for two semester. It would be sad to let it end here. So we plan working on this project in our free time.
Best wishes
Team react